
SOLUTION · AI & AUTOMATION · MEASURED (CYBER6 CORE)
Business visibility.
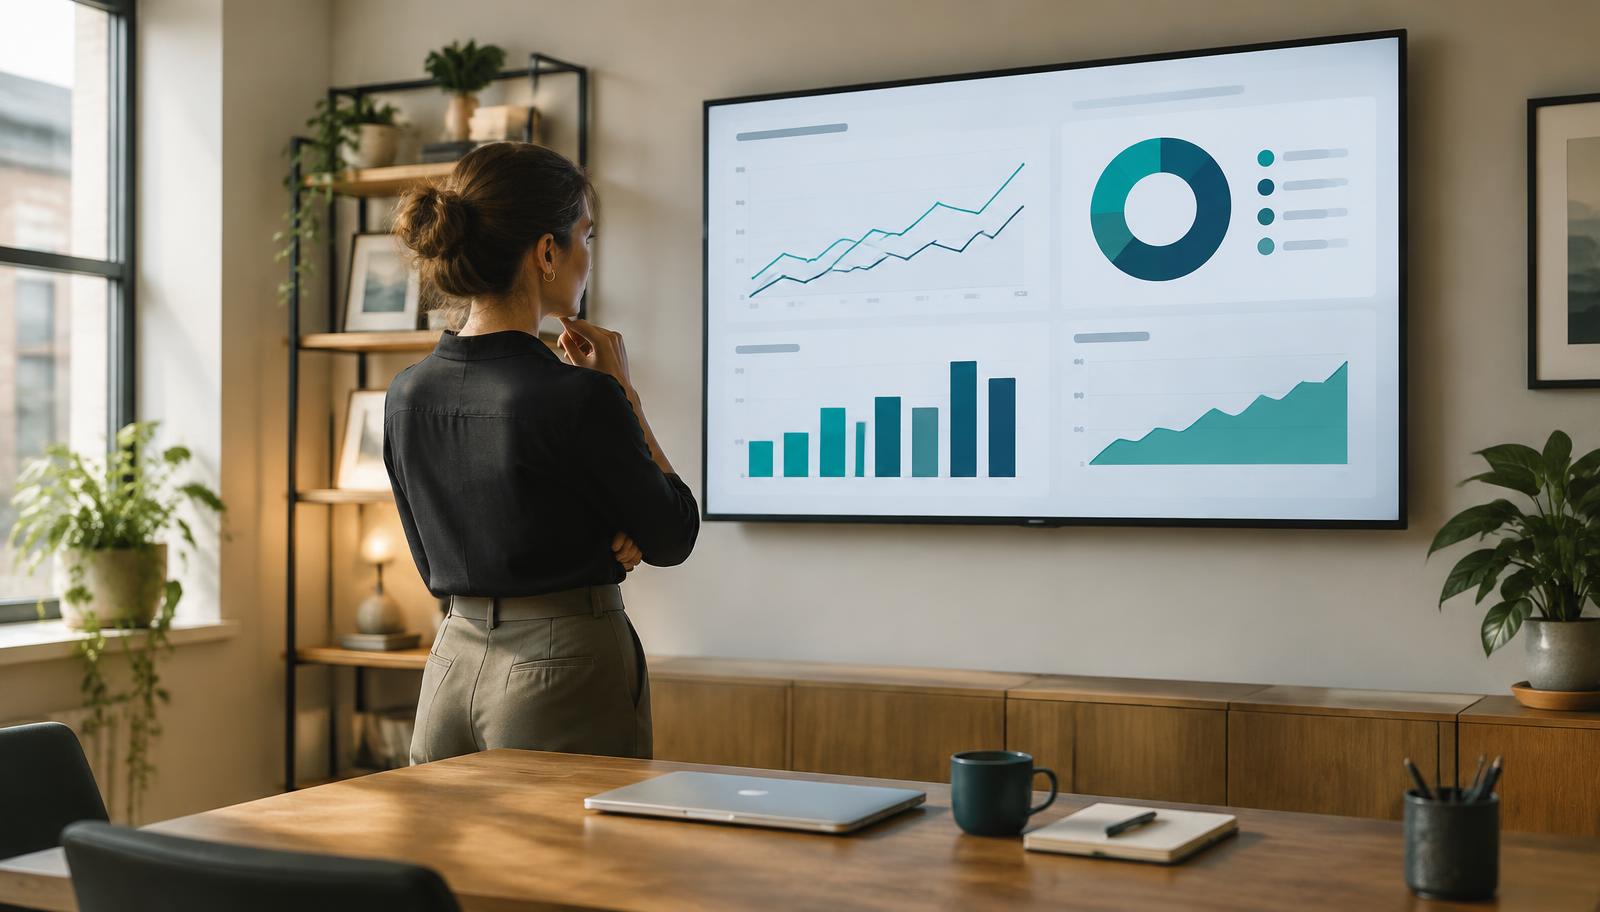
Reports arrive weeks late and don't quite agree with each other, so decisions get made on instinct. Cyber6 connects the systems you already use, watches for anomalies as they happen, and shows you the result of every change we make.
Cyber6 is an AI & technology partner: we automate the work slowing businesses down, protect them with IT & cybersecurity, and train their people.
Part of Measured (Cyber6 Core) →
WHAT'S REALLY HAPPENING
How visibility disappears as a business grows
It rarely starts with bad data. It starts with data spread across systems that don't talk to each other.
STEP 01
Numbers live in separate systems
Accounting software, a point-of-sale or job system, and a CRM each hold a piece of the picture, and none of them talk to each other.
STEP 02
Someone builds a report by hand
Once a month, someone exports data from each system and combines it manually, a slow process prone to small mistakes.
STEP 03
The report arrives after the month is over
By the time the report is finished, the period it describes has already closed, so nothing in it can still be acted on.
STEP 04
A problem hides in the numbers for weeks
A shrinking margin on one product line, or unusual returns at one store, sits inside the raw data with nobody connecting the dots.
STEP 05
The bank balance gives the first warning
The first real sign of trouble shows up in the bank balance or a bad quarter, long after the root cause could have been fixed cheaply.
WHY IT HAPPENS
Four causes sit behind most late warnings.
Select a cause to see the problems it creates in your reporting.
- Systems that don't connect: When accounting, point-of-sale, and CRM systems each hold their own numbers, nobody has one view to check. Leads to: Late reports, Disagreeing numbers, Wasted staff time.
- Reports built by hand: Manually exporting and combining spreadsheets takes hours and turns every report into a race against the calendar. Leads to: Late reports, Wasted staff time.
- No alerts on unusual patterns: Without something watching for anomalies, a problem has to grow large enough to show up in a monthly total before anyone notices. Leads to: Slow response, Decisions on instinct.
- Forecasts built on last year's averages: Without current data feeding a forecast, cash and staffing plans are really just guesses dressed up as numbers. Leads to: Weak forecasts, Decisions on instinct.
When accounting, point-of-sale, and CRM systems each hold their own numbers, nobody has one view to check.
Late reportsDisagreeing numbersWasted staff time
WHO IT HITS HARDEST
Where poor visibility hurts the most.
SCENARIO
Owners and finance leads
They make hiring and spending calls on gut feel because the numbers aren't ready in time to help.
Owners and finance leads
They make hiring and spending calls on gut feel because the numbers aren't ready in time to help.
Distributors and wholesalers
Margin disappears a few points at a time and nobody sees it until quarter end.
Industry pageRetailers
Shrink and register anomalies show up in the numbers months later without real-time alerts.
Industry pageSenior living operators
Occupancy forecasting depends on connecting inquiry, tour, and move-in data in one place.
Industry pageSIGNS THIS IS HAPPENING TO YOU
Six questions show how exposed you are.
One question at a time. The gauge moves as you answer.
Do your reports arrive within days of the period they describe?
EXPOSURE
0 gaps so far
This runs in your browser only. Nothing you choose is sent anywhere.
WHAT IT'S COSTING YOU
Poor visibility adds up to real losses.
LINE ITEM
CATEGORY
- 01MONEY
Problems caught late instead of early
A margin leak or an anomaly at one location can run for weeks before a report even surfaces it, by which point the cost has already been absorbed.
- 02RISK
Decisions made on instinct
When numbers aren't trustworthy or timely, owners fall back on gut feel, which works until it doesn't.
- 03TIME
Staff time spent assembling reports
Someone on your team likely spends real hours every week manually combining data instead of acting on it.
- 04MONEY
Forecasts that don't hold up
Cash flow and staffing plans built on stale or incomplete data are guesses dressed up as forecasts.
- 05TIME
Slower response to real problems
By the time a data issue, a shrink problem, or a client at risk shows up in a monthly report, the window to act cheaply has often closed.
HOW CYBER6 FIXES IT
One team connects the numbers and keeps them secure.
AI & Automation connects your systems and builds the alerts. IT & Cybersecurity keeps the connected data secure. Select any piece to see what it does.
AI & AUTOMATION
One connected view
We connect your accounting, point-of-sale, job, or CRM systems and bring the key numbers into a single view, using Cyber6 Core (a shared dashboard layer) to tie it together.
WHAT IT MEANS FOR YOUYou see one consistent set of numbers instead of several that don't agree.
IT & CYBERSECURITY
- AI & AUTOMATION: One connected view. We connect your accounting, point-of-sale, job, or CRM systems and bring the key numbers into a single view, using Cyber6 Core (a shared dashboard layer) to tie it together. You see one consistent set of numbers instead of several that don't agree.
- AI & AUTOMATION: Anomaly alerts. Instead of waiting for a monthly report, the system watches for unusual patterns and flags them right away. You find out about problems while they're still small.
- AI & AUTOMATION: Forecasting from real data. Cash flow, staffing needs, and demand forecasts are built from your actual current data instead of last year's averages. Plans are based on what's actually happening now, not a guess.
- AI & AUTOMATION: Before-and-after measurement. When we build an automation or fix a process, we track the before-and-after numbers so you can see the actual impact. You know which changes are working and which aren't, in plain numbers.
- IT & CYBERSECURITY: Access controls on connected data. Connecting systems together means more places data could leak if it's done carelessly, so we set up access controls and monitoring around the connections. More insight without a new security gap.
WHAT'S INCLUDED
Everything we set up, in the order we set it up.
Six pieces, set up in this order once you start.
01
Assessment
We review your current systems and reports and find the gaps and delays.
02
Connected view
Your accounting, point-of-sale, job, or CRM systems feed into one place.
03
Anomaly alerts
Alerts tuned to your business flag unusual patterns as they happen.
04
Forecasting
Cash flow and staffing forecasts built from your current data.
05
Access controls
Security settings and monitoring on every connected system.
06
Monthly review
A regular look at what the numbers are showing and what to do next.
BEFORE AND AFTER
A month of reporting, two ways.
| A typical Monday without Cyber6 | A typical Monday with Cyber6 |
|---|---|
| Reports arrive weeks late | Numbers update continuously |
| Two reports disagree on the same number | One consistent source of truth |
| Problems surface in the bank balance | Anomalies get flagged as they happen |
| Forecasts are based on last year's averages | Forecasts are built from current data |
| Someone spends hours combining spreadsheets | Reports assemble themselves |
| Decisions are made on instinct | Decisions are made on numbers you trust |
| No record of whether a change worked | Every change is measured before and after |
NO PROTECTION IS PERFECT
How it works day to day
Once it's connected, most of this runs in the background, and you get pulled in only when something needs a decision.
- 1
Connect
Your accounting, point-of-sale, job, or CRM systems feed into one view.
- 2
Watch
The system tracks the key numbers continuously and compares them to normal patterns.
- 3
Flag
An anomaly, like a margin drop or unusual activity at one location, triggers an alert to the right person.
- 4
Review
You or your team look at the flagged item and decide what to do, with the context already assembled.
- 5
Measure
Every fix or change gets tracked so you can see whether it actually worked.
WHAT WE MEASURE
Three numbers you'll see every month.
We agree a starting point during the assessment and report on these on a set schedule.
EVERY MEASURE IS TRACKED THROUGH THE CYBER6 PROVE FRAMEWORK
- Plan the goals
- Record the baseline
- Operate and observe
- Verify the results
- Evolve
PLAN THE GOALS
Problems caught early
How many anomalies were flagged before they showed up in a monthly total or the bank balance.
RECORD THE BASELINE
Forecast accuracy
How closely cash and staffing forecasts matched what actually happened.
OPERATE AND OBSERVE
Report turnaround
How long it takes from period close to a finished, reliable report.
IN YOUR INDUSTRY
What changes in your industry
BEFORE
Margin on one product line drops for weeks before anyone notices at quarter close.
AFTER
An anomaly alert flags the margin drop within days, and the cause is traced to one supplier's pricing change.
Distribution and wholesale pageWHY CYBER6
Why Cyber6 for business visibility
01
We connect what you already use
You don't need to replace your accounting or point-of-sale system. We connect what's already there.
02
Alerts tuned to your business
We set anomaly thresholds based on your normal patterns, not a generic template, so alerts are useful instead of noisy.
03
Every change gets measured
You see the actual before-and-after result of a fix, not a promise that it worked.
04
Security built into the connections
The same team that connects your systems also sets the access controls, so visibility doesn't create a new risk.
QUESTIONS
Questions people ask
Usually not. We connect to the systems you already use rather than asking you to switch.
That's common. Part of the assessment is identifying where the data is inconsistent and cleaning up what feeds into your reports.
No. It gives them better tools and removes the manual assembly work, so they can spend more time on analysis instead of data entry.
We start with your business's normal patterns and tune the thresholds with you, so alerts are useful instead of noisy.
Yes. We set up access controls and monitoring as part of the build, and connecting systems doesn't mean giving up control of the data.
Simple connections can be running within a couple of weeks. More complex forecasting takes longer to tune properly.
We build views for different roles, so an owner, a manager, and a bookkeeper each see what's relevant to them from the same underlying data.
Yes. Showing a lender or investor a before-and-after number instead of a claim tends to move conversations faster.
WHO WE'VE WORKED WITH
- Small businesses
- A statewide cybersecurity assessment program
- Credit unions
- A water and wastewater utility
- Housing organizations
- Nonprofits and churches
- A health and wellness startup
Every result is measured against your own starting point.
How we prove it →PART OF ONE PARTNER
One partner for all three.
Automate · AI & Automation
AI & automation that moves your business forward.
You're here
Empower · Training for Businesses & Individuals
Training that builds skills for your team and your career.
Explore Empower
WHY CYBER6
Why businesses choose Cyber6.
One partner, not three vendors
The people automating your work also run and protect your IT and train your team, so nothing falls between companies.
Plain language and real people
You talk to people who explain things clearly, answer the phone, and tell you what they'd do in your place.
Measured against your own numbers
We record where you start before anything changes, then report results against that baseline.
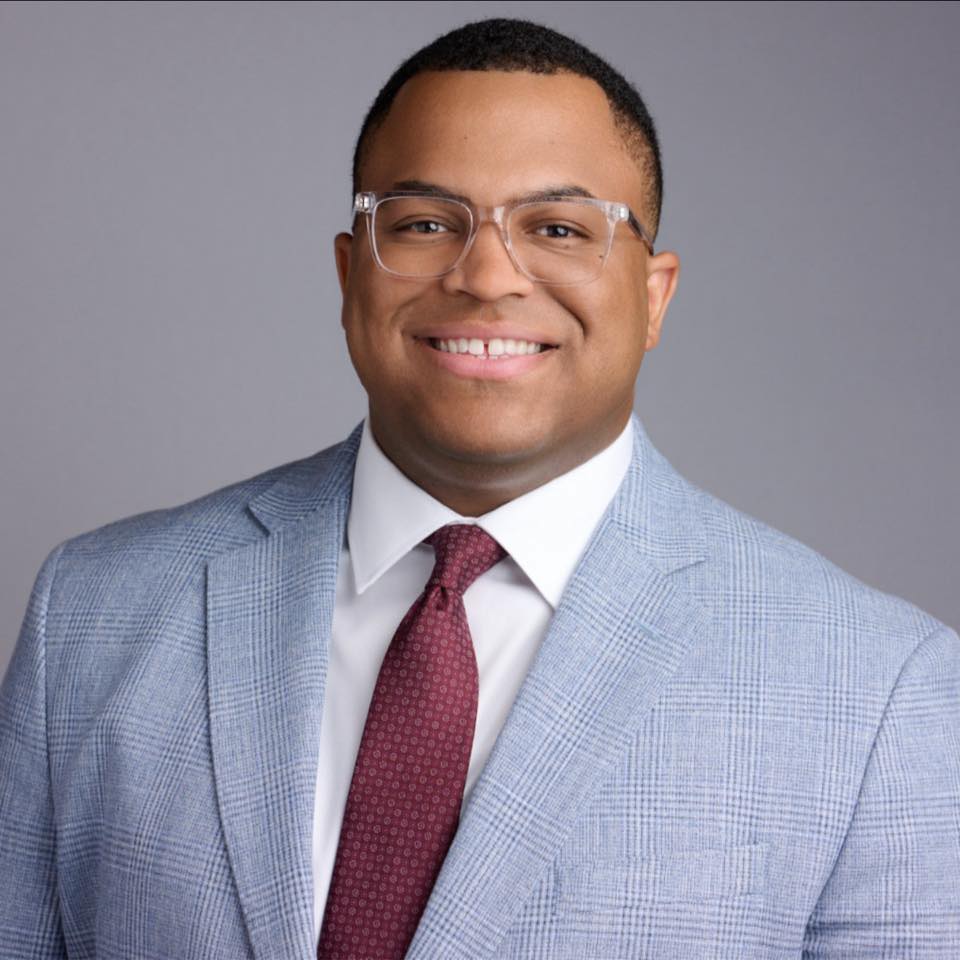
Marquis Carroll, Founder & CEO. Marquis has spent years doing hands-on IT and security work through his own business, and runs a mentorship program that has helped people start careers in tech.
Our storyGETTING STARTED
Four steps from first call to results.
Explore
A relaxed 30-minute conversation about how your business runs and what's getting in the way. No cost, no pressure.
You get: honest answers on whether we can help.
Assess
We look at your systems, security, manual work, and training needs, and record your starting numbers.
You get: a plain-English picture of your risks and opportunities.
Set up
A prioritized plan and proposal, then a kickoff that introduces your team and sets up access safely.
You get: a shared timeline and who to call for what.
Enable
We roll out in phases, train your team, and walk you through your first results.
You get: your first plain-English report, measured with PROVE.
Let's build a dashboard you can trust.
A 30-minute call. No cost, no pressure, and honest answers.